CHIPPY CHAMPIONSHIP

With more regular season penalty minutes than any team in the league, the 2007 Anaheim Ducks still manage to thrash their way to a Stanley Cup Championship
What do the NHL payroll rankings look like over time? How does that relate to regular season points or even Stanley Cup winners? What about Penalty Minutes, how does that impact results? Explore those questions for a number of interesting metrics in this interactive tool. Choose a metric from the buttons below and hover to highlight different teams. Click the chart to toggle the tooltips on and off.
We've highlighted a few interesting stories at the bottom.
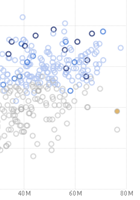
Payroll compared to regular season points
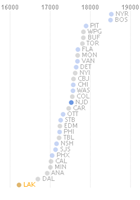
A look at Payroll (USD) for just one year
With more regular season penalty minutes than any team in the league, the 2007 Anaheim Ducks still manage to thrash their way to a Stanley Cup Championship
Nobody came to watch regular season games when the 2012 Los Angeles Kings were in town, but the low road attendance didn’t stop the Kings from taking home the Cup.
In 2003 the New York Rangers paid over $76 million in salaries and they didn’t even make the playoffs. Then they did the same thing in 2004, and got the same result.
| All Years | 2012 | Rank | |
|---|---|---|---|
| Regular Season Points | |||
| Payroll | |||
| Road Attendance | |||
| Goals Scored | |||
| Goal Differential | |||
| Shots on Goal | |||
| Shooting % | |||
| Penalty Minutes | |||
| Hit Differential | |||
| Power Play % | |||
| Penalty Kill % | |||
| Shot Attempt % | |||
| Save % |
Click anywhere to toggle tooltips on/off